Root Cause Analysis Template: 5 Whys, Fishbone, and Action Plan
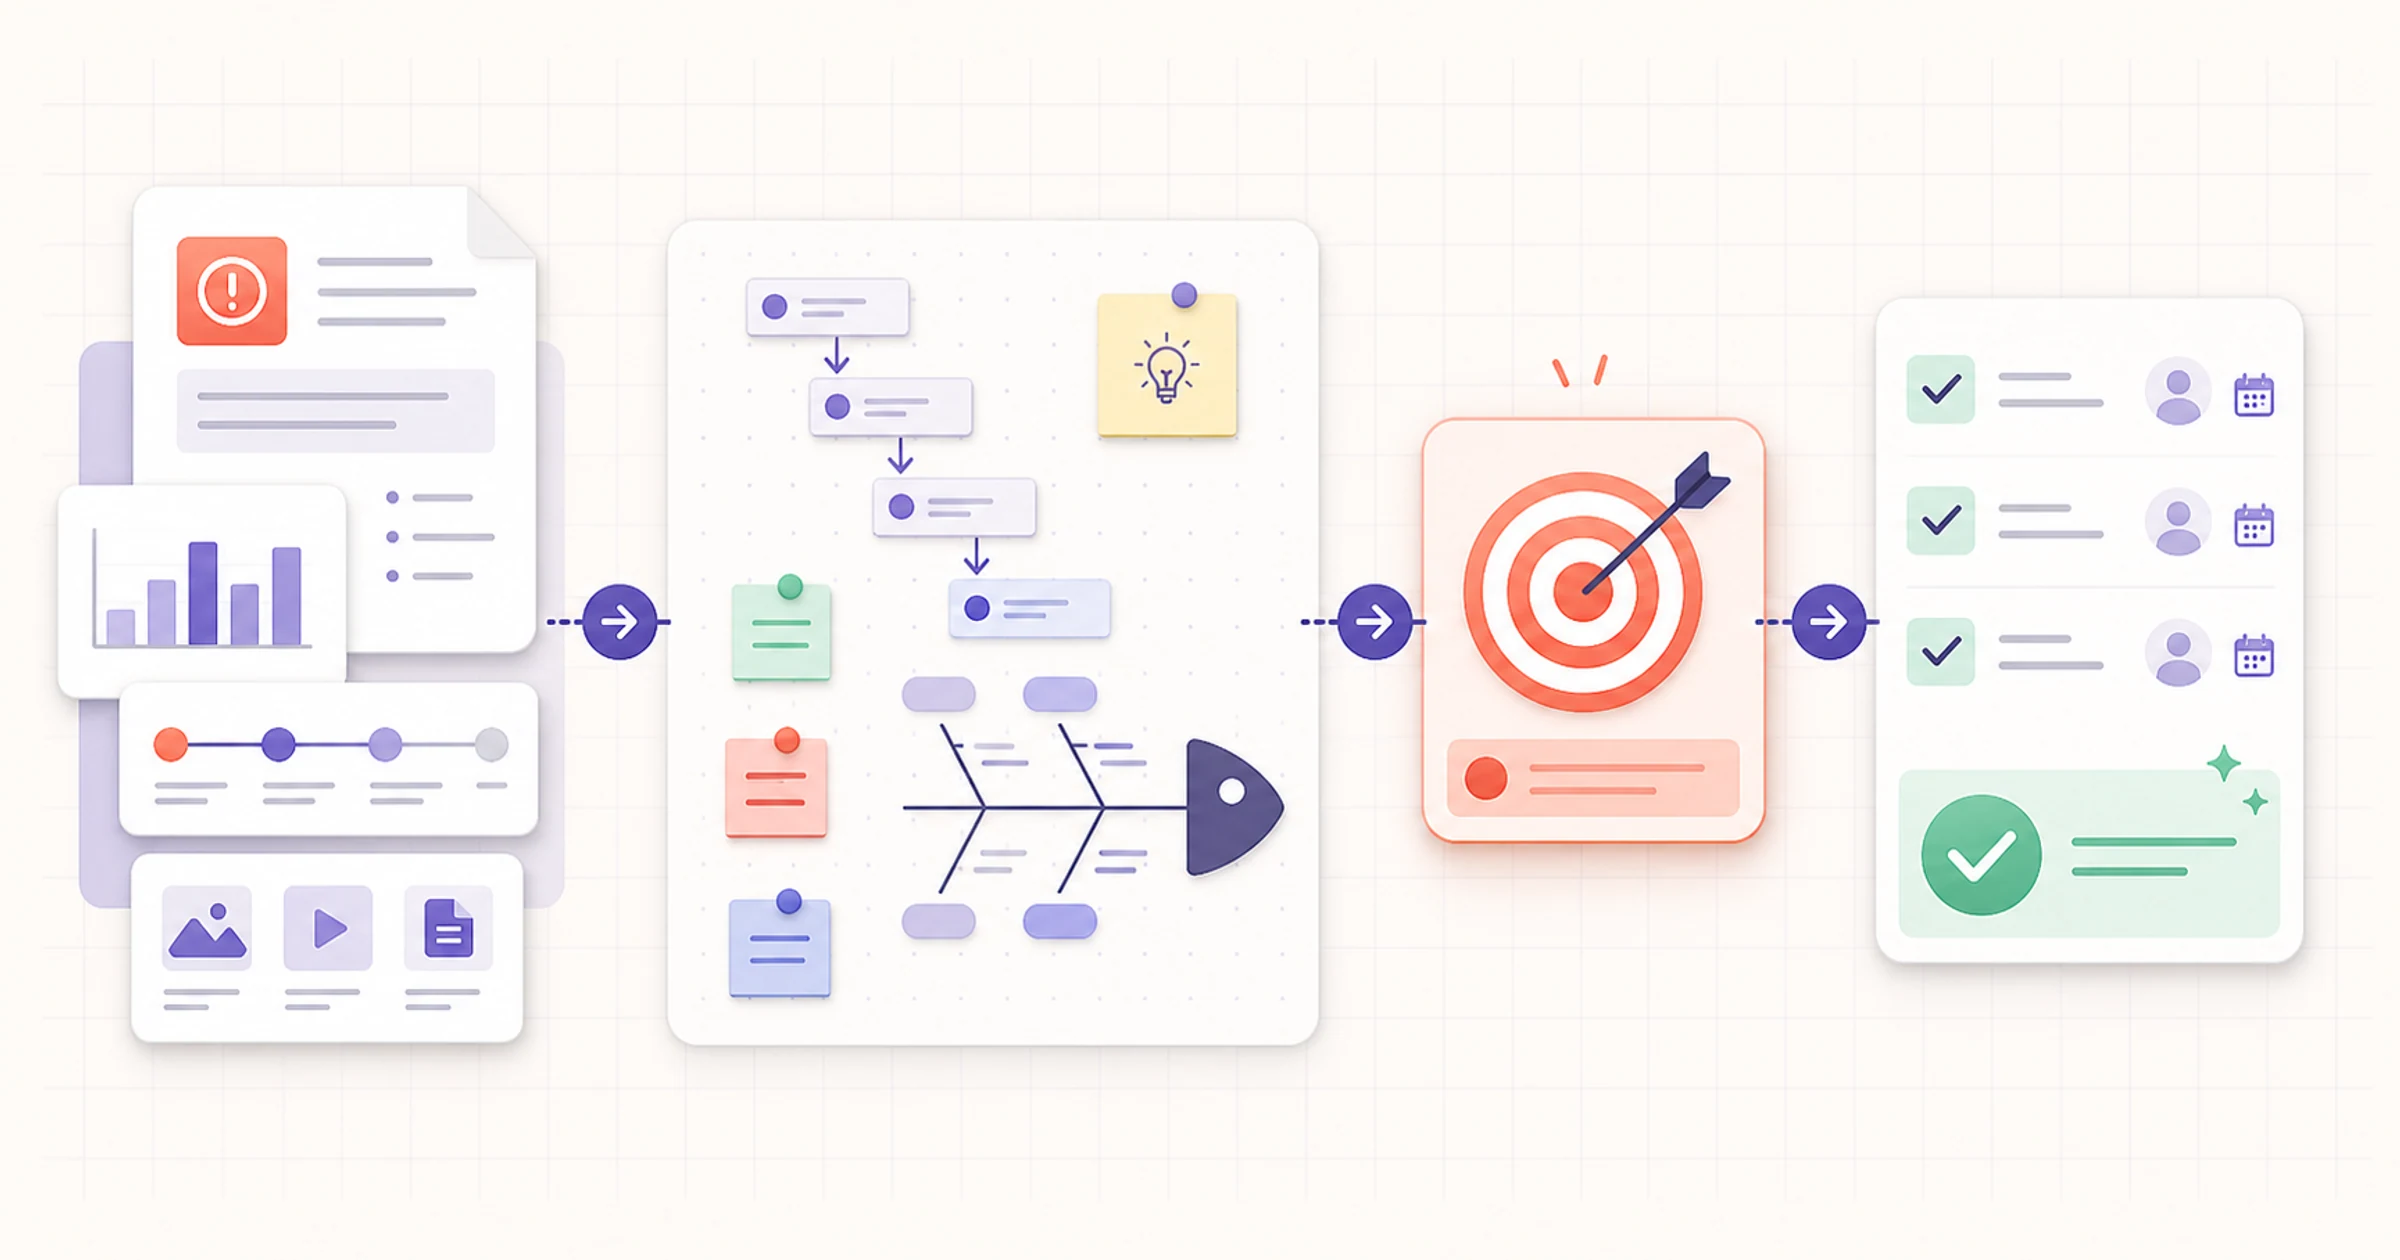
A root cause analysis template is a structured record for defining a recurring or consequential problem, organizing evidence, testing possible causes, and assigning corrective actions. Use one when a quick fix has failed, a problem keeps returning, or several teams need one defensible account of what happened. At minimum, the template should capture the problem, scope, timeline, evidence, knowns and unknowns, contributing factors, analysis method, root cause statement, action owner, due date, verification measure, and review date.
Definition: A root cause analysis template is a reusable worksheet that connects a factual problem statement and evidence to possible causes, tested findings, corrective actions, owners, and follow-up measures. It helps a team separate symptoms from system conditions and document why a proposed action should reduce recurrence.
This guide is for operations managers, project leads, quality leads, and support leaders. It presents a general workflow, not a substitute for the investigation, reporting, legal, safety, medical, or regulatory requirements that may apply to a specific event.
Key takeaways
- Define one observable problem before discussing causes or solutions.
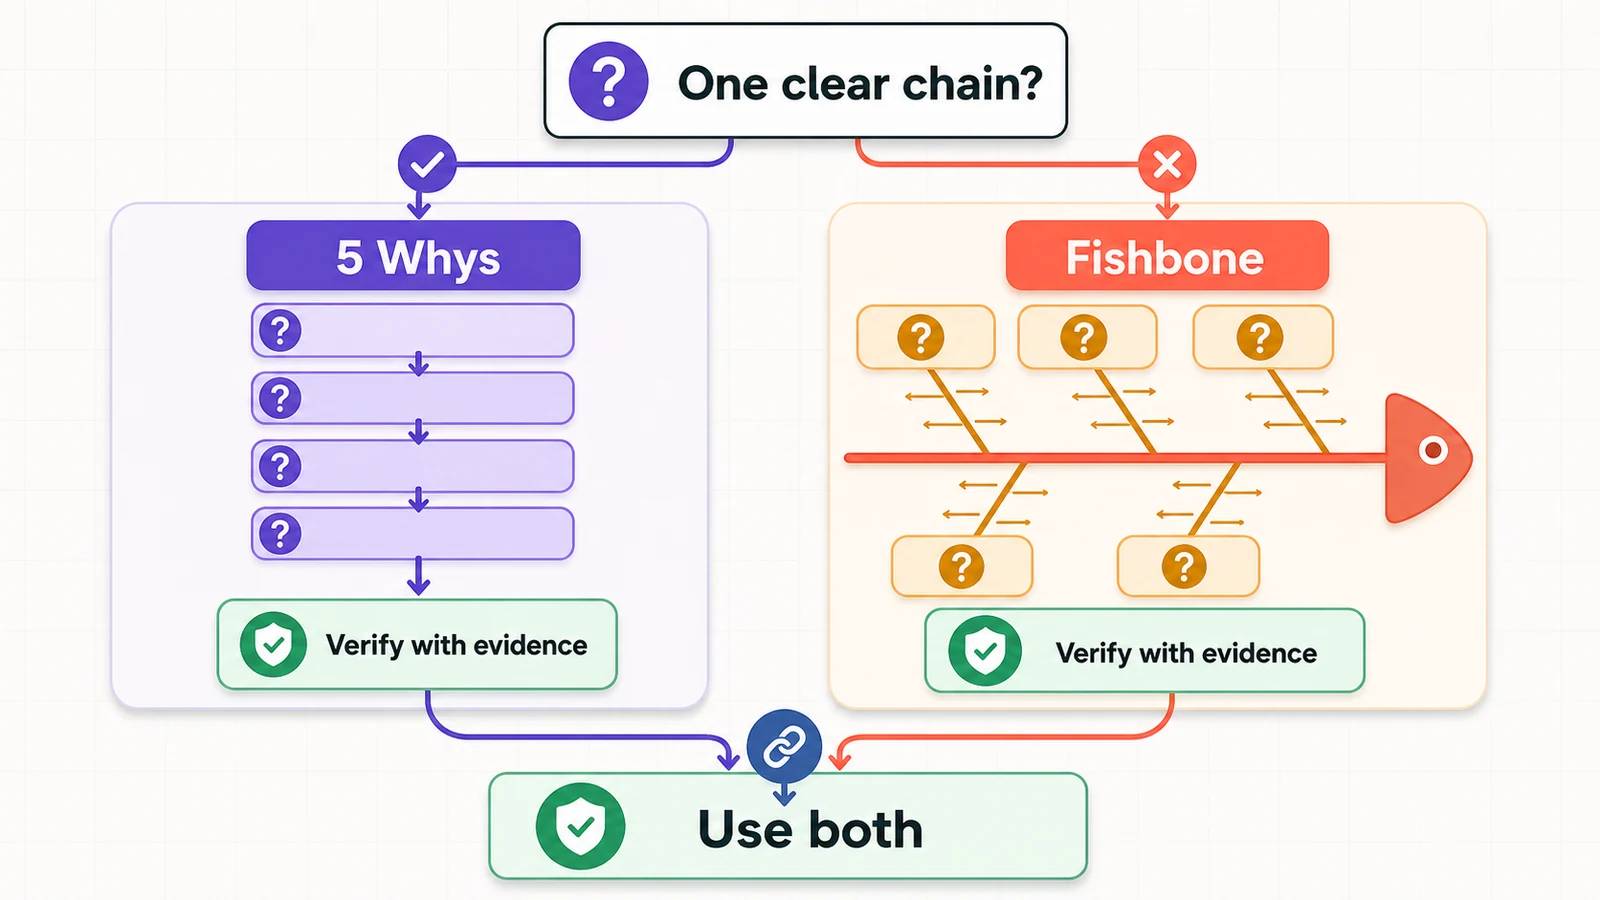
- Use 5 Whys for a reasonably clear causal chain; use a fishbone diagram when several categories may interact.
- Treat every proposed cause as a hypothesis until evidence supports it.
- Assign actions to named owners and verify effectiveness with a measure, threshold, and review date.
Table of contents
- Root cause analysis template (copy and use)
- How to complete a root cause analysis in 7 steps
- 5 Whys vs. fishbone: which method should you use?
- Worked example
- How to write a defensible root cause statement
- Common root cause analysis mistakes
- How to run the workflow in AFFiNE
- Frequently asked questions
Root cause analysis template (copy and use)
Copy the template below into a shared document. Keep facts, assumptions, and decisions in separate fields so a reviewer can follow the reasoning.
ROOT CAUSE ANALYSIS

1. ANALYSIS DETAILS
RCA title:
RCA lead:
Contributors:
Date opened:
Target review date:

2. PROBLEM STATEMENT
Expected condition:
Observed condition:
Where and when it occurred:
Frequency or magnitude:
Who or what was affected:

3. IMPACT AND SCOPE
Immediate impact:
Processes, teams, customers, or deliverables in scope:
Explicitly out of scope:
Temporary containment already applied:

4. TIMELINE
[Date/time] — [Observed event] — [Evidence reference]
[Date/time] — [Observed event] — [Evidence reference]
[Date/time] — [Observed event] — [Evidence reference]

5. EVIDENCE
Evidence ID | Source | Observation | Reliability/limitation | Owner
E-01        |        |             |                        |
E-02        |        |             |                        |

6. KNOWN / UNKNOWN
Known facts:
-
Unknowns that could change the conclusion:
-
Assumptions to test:
-

7. CONTRIBUTING FACTORS
People/coverage:
Process/method:
Tools/equipment:
Information/materials:
Measurement/monitoring:
Environment/external conditions:

8. 5 WHYS
Problem:
Why 1? Answer:                         Evidence:
Why 2? Answer:                         Evidence:
Why 3? Answer:                         Evidence:
Why 4? Answer:                         Evidence:
Why 5? Answer:                         Evidence:
Alternative branch or stopping point:

9. FISHBONE CATEGORIES
Category | Possible cause | Supporting evidence | Contradicting evidence | Status
         |                |                     |                        | Open/Tested/Rejected

10. ROOT CAUSE STATEMENT
Because [specific system or process condition], [direct mechanism] produced
[observed problem]. This conclusion is supported by [evidence IDs].
Confidence and remaining uncertainty:

11. ACTION PLAN
Type | Action | Cause addressed | Owner | Due date | Completion evidence
Corrective | | | | |
Preventive | | | | |

12. EFFECTIVENESS VERIFICATION
Measure:
Baseline:
Target/threshold:
Measurement window:
Data owner:
Review date:
Result and decision: Effective / Partly effective / Not effective / Too early

13. APPROVAL AND FOLLOW-UP
Reviewer(s):
Decision date:
Open risks or follow-up RCA:
The template deliberately keeps completion evidence separate from effectiveness evidence. Publishing a checklist proves that an action was completed; it does not prove the underlying problem became less likely.
How to complete a root cause analysis in 7 steps
1. Define one observable problem
Compare what should have happened with what actually happened. Include a time, place, frequency, or magnitude when the records support it. “Reports are unreliable” is too broad. “Three of the last four reports missed the Monday 3 PM handoff target” can be checked.
Do not place a cause or solution inside the problem statement. “The report was late because the analyst forgot” has already judged both mechanism and responsibility.
2. Stabilize the work and collect evidence
Apply any reasonable temporary containment without confusing it with a permanent correction. Then assemble timestamps, version history, process steps, messages, measurements, and interviews. Record each source and its limitation. A recollection can add context, but it should not silently override a system timestamp.
The American Society for Quality defines root cause analysis as a family of approaches for uncovering causes, not a single form. Its RCA overview emphasizes finding a core issue that can be addressed through process improvement.
3. Build the timeline and separate knowns from unknowns
Put the evidence in time order. Mark what is established, what is inferred, and what still needs testing. This prevents a plausible story from turning into an accepted fact merely because it was written first.
Unknowns are useful. “We do not yet know whether late input was the only cause” tells the team what evidence could change the decision.
4. Generate possible causes
Use 5 Whys when the path appears mostly sequential. Use a fishbone diagram when the problem could involve process, people, information, tools, measurement, or environmental factors. The goal is to expand the candidate set before narrowing it.
For a deeper method guide, see AFFiNE's fishbone diagram template article. If you want a ready-made visual starting point, open the editable fishbone diagram template.
5. Test and eliminate candidate causes
Ask what evidence would be expected if each candidate were true. Compare periods, cases, teams, or conditions when appropriate. Look for contradictory evidence and alternative explanations. A correlation, sequence, or consensus vote can prioritize a hypothesis; none proves causation by itself.
The U.S. Department of Energy's archived Root Cause Analysis Guidance Document distinguishes causal factors from root causes and connects findings to corrective action. Your organization may require a different or more formal method.
6. Write the root cause statement and assign actions
State the controllable system condition, the mechanism through which it produced the problem, and the evidence supporting that link. Then map each action to a cause. Give every action one accountable owner and due date.
Separate corrective action, which addresses the observed cause, from preventive action, which reduces a similar exposure elsewhere. Avoid action lists that contain only reminders or retraining unless the evidence shows knowledge was the relevant gap.
7. Verify effectiveness and close deliberately
Choose the measure, baseline, threshold, observation window, and review date before declaring the RCA closed. If the issue is infrequent, combine a lagging outcome measure with a leading process measure. For example, track both whether the report was on time and whether all source data passed the cutoff and completeness check.
If the target is missed, reopen the analysis instead of editing the original prediction after the fact. Preserve the learning trail.
5 Whys vs. fishbone: which method should you use?
| Decision point | 5 Whys | Fishbone diagram | Use both |
|---|---|---|---|
| Best fit | A narrow problem with a mostly sequential mechanism | A problem with several plausible cause categories or team perspectives | A complex problem where one promising branch needs deeper analysis |
| Output | A chain of increasingly specific “why” answers | A categorized map of possible causes | A broad cause map plus a tested chain for selected branches |
| Strength | Fast, simple, and easy to explain | Reduces tunnel vision and makes gaps visible | Balances breadth with depth |
| Main risk | One facilitator's assumptions create a tidy but false chain | Brainstormed causes are mistaken for proven causes | Extra complexity without disciplined evidence checks |
| Evidence rule | Support every answer; branch when more than one answer is plausible | Mark each cause open, tested, or rejected | Verify the final claim independently of the diagram |
The Lean Enterprise Institute explains that the number five is not a quota: keep asking until the team reaches a cause it can address and support. Its 5 Whys overview also places follow-up checks and standards inside the wider problem-solving cycle.
The American Society for Quality describes a fishbone diagram as a way to identify many possible causes and sort them into useful categories. That wording matters: the diagram organizes possibilities. It does not, by itself, establish which branch caused the outcome.
Worked example: a late weekly status report
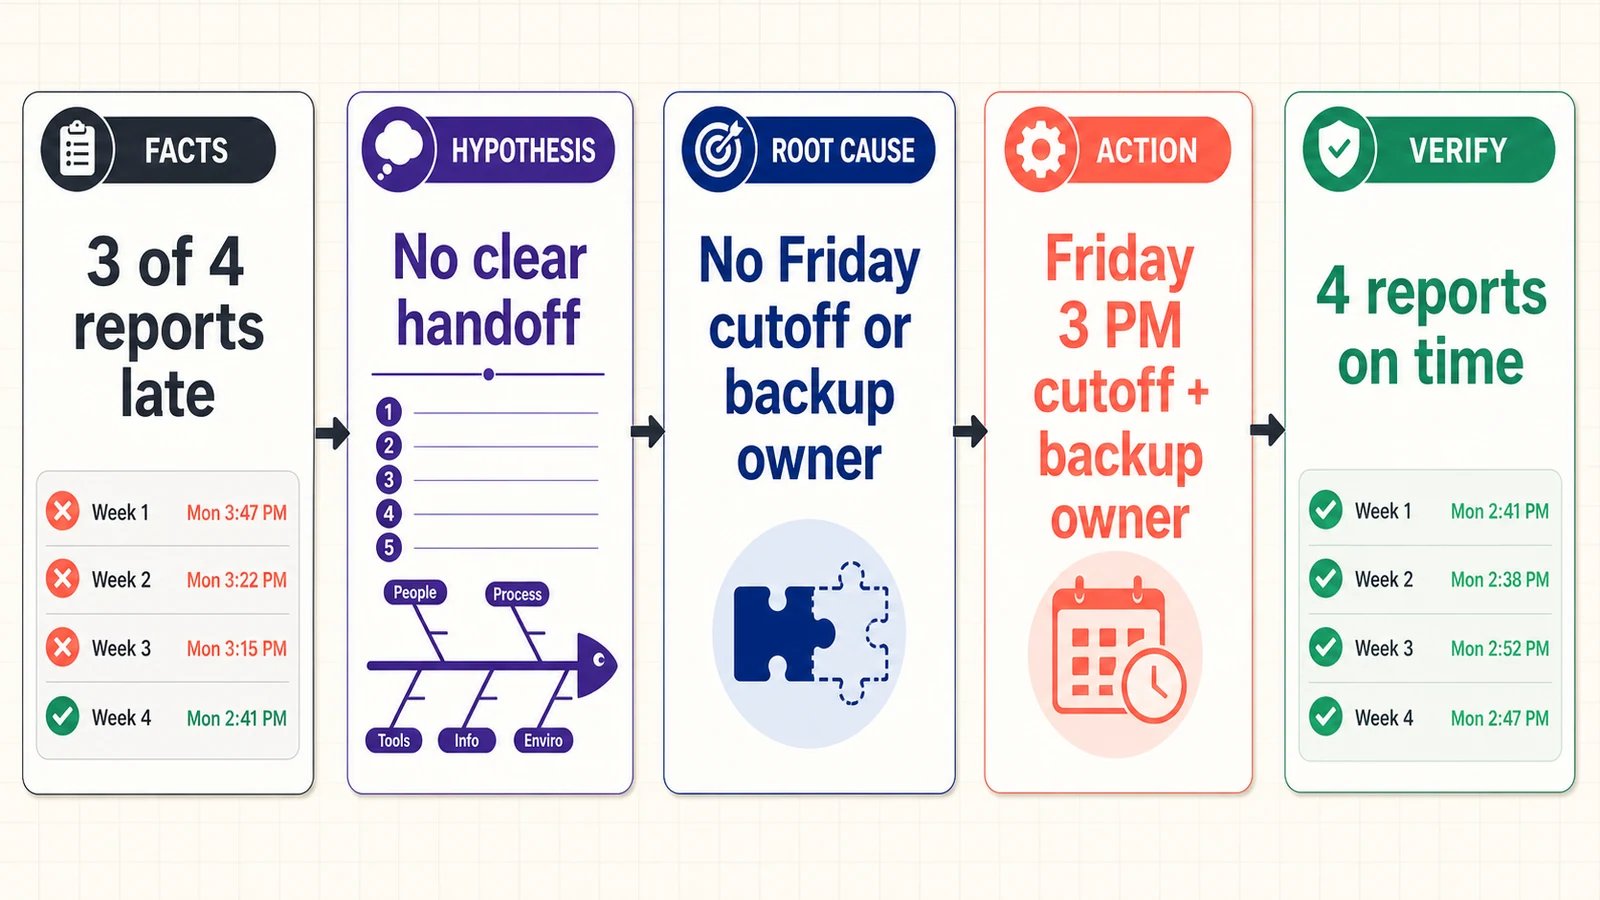
This neutral example is illustrative. The dates, roles, and observations are fictional. Labels show which entries are facts and which remain hypotheses.
Completed template
| Field | Completed example |
|---|---|
| Problem statement | Fact: The client status report had a Monday 3 PM internal handoff target. Three of the last four reports were sent 15–47 minutes late. |
| Impact and scope | Fact: The account lead began review late. No missed client deadline was recorded. Scope is the weekly data-to-report handoff, not report quality. |
| Timeline | Fact: Week 1 sent 3:47 PM; Week 2, 3:22 PM; Week 3, 3:15 PM; Week 4, 2:41 PM. In the three late weeks, the shared source table was last changed after 11:30 AM Monday. |
| Evidence | Message timestamps, file version history, the current process note, and interviews with the report owner and two contributors. Interview recollections were checked against timestamps where possible. |
| Known | There was no documented input cutoff, completeness check, or backup report owner. |
| Unknown | Whether late input was the only cause; whether an earlier cutoff would create incomplete data; whether tool access also delayed assembly. |
| Contributing factors | Process: no cutoff. Coverage: no backup. Information: input requirements varied. Tools: reminder and completeness status were manual. |
| 5 Whys | 1. Why late? Assembly started after noon. 2. Why? Required inputs were incomplete until late morning. 3. Why? Contributors submitted when their updates were ready. 4. Why? No shared cutoff or completeness check existed. 5. Why? The reporting workflow was created without an intake service level or backup role. |
| Fishbone status | Process cutoff: supported. Backup coverage: supported. Tool outage: rejected for the sampled weeks. Contributor carelessness: rejected as vague and inconsistent with the absence of a deadline. |
| Root cause statement | Because the weekly intake workflow had no Friday 3 PM cutoff, completeness check, or backup owner, required inputs could arrive after the Monday assembly window had begun, causing the internal report handoff to miss its target. Supported by E-01 timestamps, E-02 version history, and E-03 process documentation. |
| Corrective action | Operations lead documents a Friday 3 PM input cutoff, required fields, completeness check, and escalation path. Due August 14, 2026. |
| Preventive action | Support manager assigns and rehearses one backup report owner. Due August 21, 2026. |
| Verification | Four consecutive reports handed off by Monday 3 PM, with all required inputs complete by the Friday cutoff. Review on September 21, 2026. If either condition fails, reopen the RCA. |
The observations and timestamps are facts within this fictional example. “No clear handoff” begins as a hypothesis. It becomes a supported root-cause statement only after the current process note, version history, and rejected alternatives align with it.
How to write a defensible root cause statement
Use this structure:
Because [specific system condition], [direct mechanism] produced [observable problem]. This is supported by [evidence], while [important alternative] was rejected because [contradicting evidence].
A defensible statement is specific enough to act on, but no more certain than the evidence allows. Use “supported,” “most consistent with,” or a confidence qualifier when key uncertainty remains.
Avoid three common endpoints:
- Blame: “Jordan failed to send the report.” This names a person without explaining the conditions that made failure likely or undetected.
- Human error: “The analyst forgot.” Ask what cue, check, access, workload, interface, or coverage condition allowed that lapse to reach the outcome.
- Solution in disguise: “The root cause was no training.” This reverses from a preferred remedy. First show that a knowledge gap existed and caused the problem.
Run a replacement test: if the person were replaced tomorrow but the same process remained, could the problem recur? If yes, the statement probably stops too early.
Common root cause analysis mistakes
- Starting with a vague problem. Replace labels such as “poor communication” with an observable gap, period, and scope.
- Treating the first explanation as the cause. Record it as a hypothesis and ask what would confirm or contradict it.
- Forcing exactly five whys. Stop earlier when evidence reaches a controllable cause; continue or branch when the chain remains superficial.
- Using fishbone voting as proof. Voting prioritizes investigation. Test the highest-priority branches with records, comparisons, or controlled changes.
- Ending at “human error.” Examine the process, information, tools, safeguards, and workload that shaped the action.
- Assigning actions without owners. Use one accountable owner, a due date, and completion evidence for every action.
- Confusing completion with effectiveness. A new checklist can be complete while the failure rate stays unchanged. Define an outcome measure and observation window.
- Ignoring new risks. Review whether the corrective action shifts delay, cost, or error into another step.
How to run the workflow in AFFiNE
Start in AFFiNE Docs. Keep the problem statement, timeline, evidence links, knowns and unknowns, root cause statement, and action table in one structured page. This creates a readable record for reviewers who were not in the workshop.
Switch the same document to the AFFiNE Edgeless whiteboard when the team needs to map a 5 Whys chain or spread possible causes across fishbone categories. AFFiNE's current product pages state that the same blocks can work in page and edgeless views, so teams can move between structured writing and visual analysis without copying the investigation into a separate artifact.
After the analysis, return to the page view and convert decisions into an action table with owners, due dates, and verification measures. A project planner can help when the corrective actions have dependencies or several milestones.
AFFiNE can organize documents, visual maps, links, and collaborative review. It does not automatically determine a root cause, validate evidence, approve corrective actions, or replace a professional investigation or compliance system. The team remains responsible for method choice, access control, evidence quality, decisions, and follow-up.
Frequently asked questions
How do you write a root cause analysis?
Define one measurable problem, collect evidence, build a timeline, separate knowns from unknowns, and generate possible causes. Test those causes with supporting and contradicting evidence, then write a specific root cause statement. Assign actions to owners with due dates and define an effectiveness measure and review date before closing the analysis.
What are the five steps in a root cause analysis?
A compact five-step model is: define the problem, collect evidence, analyze possible causes, implement corrective actions, and verify effectiveness. For better traceability, this guide expands the middle into seven steps by separating the timeline, hypothesis generation, and cause testing. The exact count matters less than preserving evidence, ownership, and follow-up.
What are the 5 P's of root cause analysis?
There is no universal 5 P's standard for RCA. One published industrial Root Cause Failure Analysis framework uses Parts, Position, Paper, People, and Paradigms to organize evidence. Other organizations use different P-lists, so confirm the method your procedure names. Whatever the labels, treat categories as collection prompts—not proof of causation. See this documented 5 P's example.
What are seven root cause analysis techniques?
Seven common techniques are 5 Whys, fishbone diagrams, change analysis, event-and-causal-factor analysis, fault tree analysis, Pareto analysis, and failure mode and effects analysis. They answer different questions. Select a method based on problem complexity, available evidence, risk, and any required industry procedure rather than using the longest method by default.
Is this a free root cause analysis template?
Yes. You can copy the template in this article into a document and adapt the fields to your team. The text is method-neutral and includes 5 Whys, fishbone categories, corrective actions, owners, deadlines, and verification. Check whether your organization requires an approved form, retention rule, review process, or specialist before using it for regulated work.
Should I use a 5 Whys or fishbone root cause analysis template?
Use 5 Whys for a narrow problem with a reasonably clear sequence. Use a fishbone template when several categories or teams may contribute. Combine them by using fishbone analysis to generate candidate branches, then apply 5 Whys to the strongest branches. In every case, verify the final cause with evidence outside the diagram.
Turn analysis into a verified action plan
A useful root cause analysis template does more than capture a persuasive story. It links a precise problem and evidence to tested causes, accountable corrective actions, and a future check. Copy the template, choose 5 Whys, fishbone, or both, and decide how you will verify the result before the team starts implementing solutions. If you want one workspace for the written record and visual analysis, try the workflow in AFFiNE while keeping the investigation and final judgment in qualified human hands.