Timing Diagram: Your Guide to Visualizing Sequential Processes
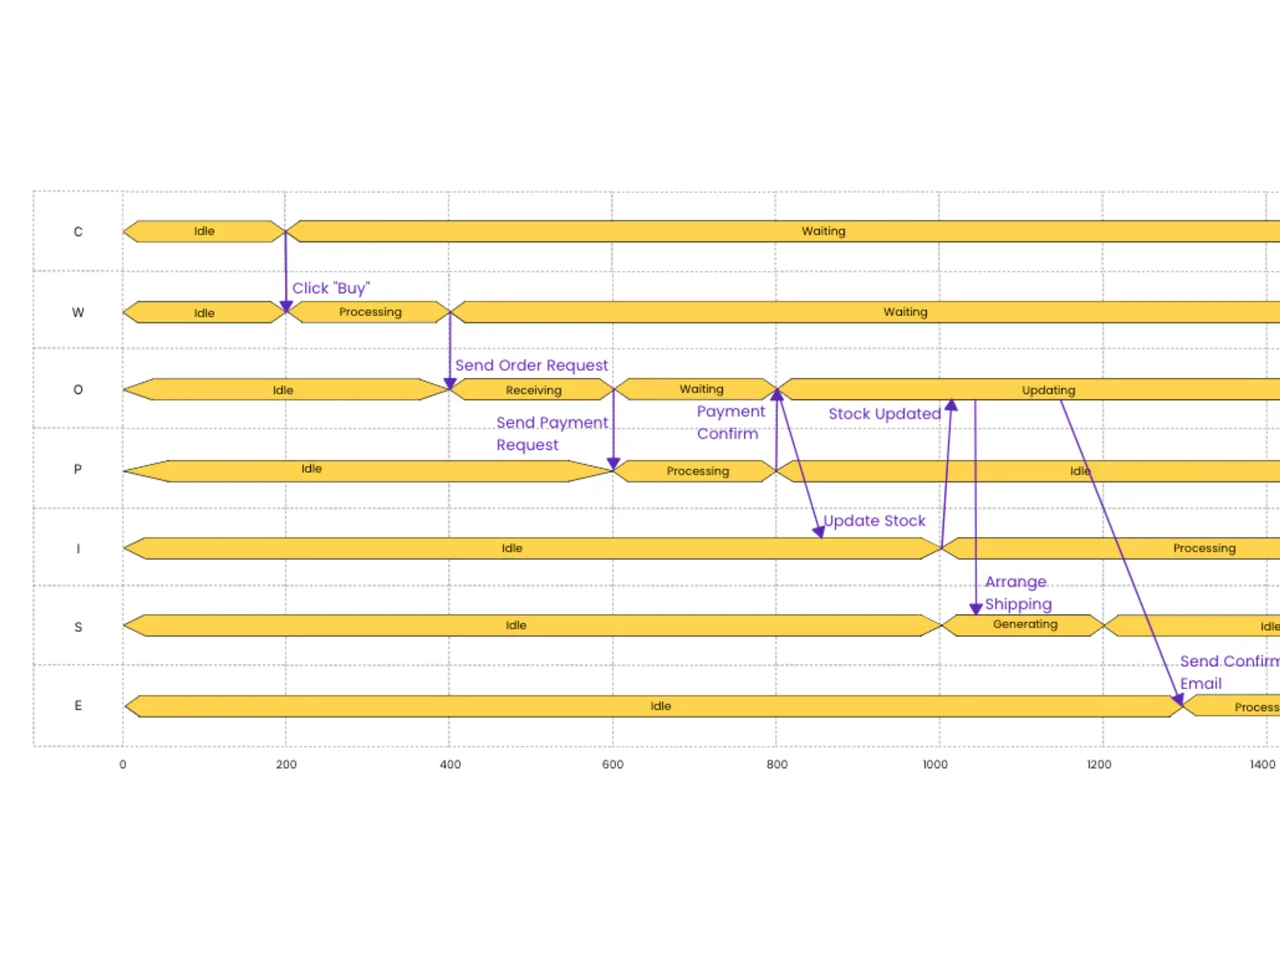
A timing diagram helps engineers and system designers see how signals change over time and how sequential processes interact. Our customizable timing diagram template offers a professional framework for representing clock cycles, signal transitions, and temporal relationships among components, making it easier to document, analyze, and communicate complex sequential behaviors in digital systems, circuits, and event-driven processes.
Why Use a Timing Diagram?
Precise Signal Visualization
Timing diagrams give crystal-clear visual representations of how several signals interact with one another. This template allows you to capture precise timing connections, signal transitions, and event sequences, making it ideal for troubleshooting digital circuits, verifying protocols, or describing system behaviors to team members and stakeholders.
Complex System Analysis
When building or debugging sequential systems, knowing temporal logic and event ordering is crucial. This timing diagram template allows you to map out clock cycles, compute propagation delays, and spot potential timing violations or race circumstances before they cause issues in your implementation.
Clear Technical Communication
Effective documentation of system timing is critical for team cooperation and knowledge transfer. This template allows you to generate professional timing charts that clearly show waveform patterns, state transitions, and temporal connections, ensuring that everyone knows how your system works across time domains and clock zones.