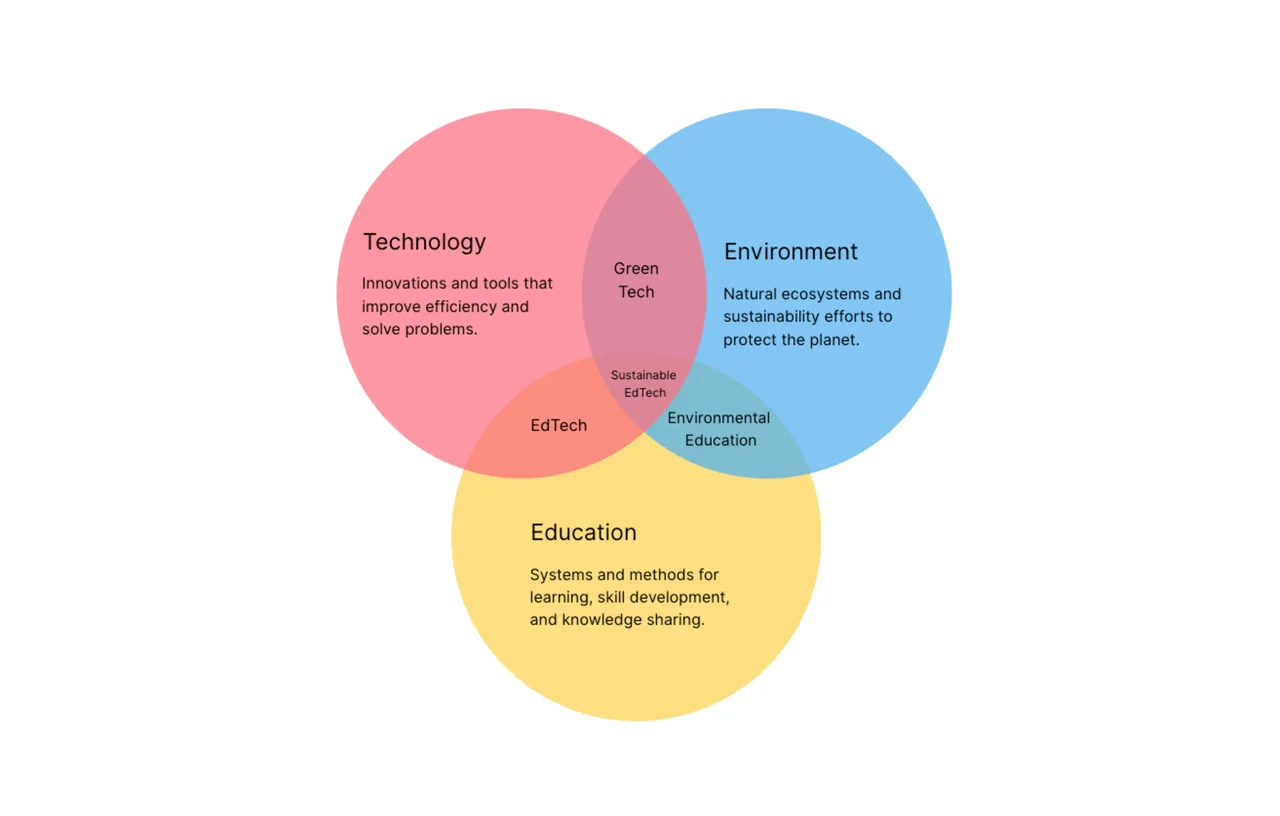
Venn Diagram: Your Guide to Visual Relationship Analysis
A Venn diagram template is an effective visual framework for comparing collections of data and determining their links. This simple tool use overlapping circles to concisely highlight similarities and contrasts between ideas, making complicated data linkages instantly accessible. A well-designed Venn diagram may translate abstract linkages into obvious visual insights, whether you're studying market divisions, comparing project needs, or investigating conceptual connections.
Why Use a Venn Diagram Template?
Simplified Complex Relationships
Venn diagrams are excellent at breaking down complicated relationships into visually understandable components. When working with numerous sets of data, the overlapping circles offer a clear visual language that allows all stakeholders to quickly recognize commonalities and distinctive characteristics, making comparative analysis easier.
Enhanced Decision Making
Venn diagrams help to make better decisions by visually expressing overlap analysis across different data sets. The template helps you to easily see where concepts overlap, assisting teams in identifying opportunities, resolving issues, and making choices based on a thorough grasp of the interactions between various aspects.
Effective Visual Communication
Venn diagrams are a visual thinking tool that express complicated information in an easy-to-understand style. This template converts abstract relationships into actual visual representations, making your presentations, reports, and analyses more engaging and accessible, while also guaranteeing that your audience understands the comparative links between various sets of data.